Beyond legal #11: Stop counting activities and start measuring outcomes
In this eleventh post of my "beyond legal" series, I'm addressing perhaps the most forgotten about competency in data protection leadership: the ability to measure what actually matters. Many data protection functions are stuck in a rear-view mirror mindset, counting compliance activities instead of driving forward-looking performance that demonstrates real business value.
DATA PROTECTION MATURITYDATA PROTECTION LEADERSHIPGOVERNANCEDATA PROTECTION METRICS
Tim Clements
10/26/20257 min read
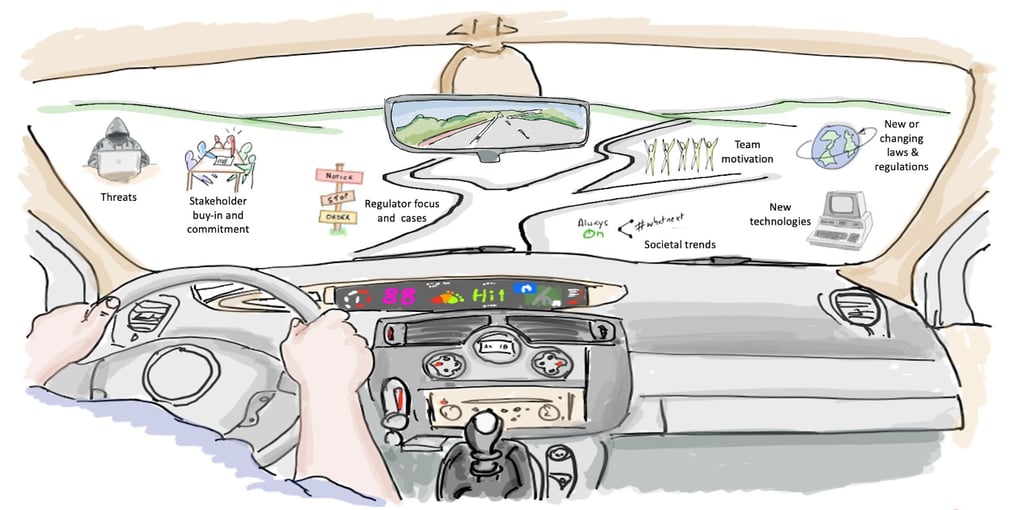

As I was thinking about, and preparing this post, I remembered reading about something country music artist Jelly Roll said a year or two ago when he won "New Artist of the Year" at the CMA Awards: "The windshield is bigger than the rear view mirror for a reason, because what's in front of you is more important than what's behind you."
This epitomises the performance measurement revolution that data protection desperately needs. Too many data protection leaders and their teams are stuck looking backwards counting DPIAs completed, training modules finished, and incidents that already happened, to name a few examples. Meanwhile, they're missing the critical forward-looking indicators that could prevent problems and demonstrate strategic value.
When busy doesn't mean effective
I've participated in quite a few client data protection team meetings and heard updates like:
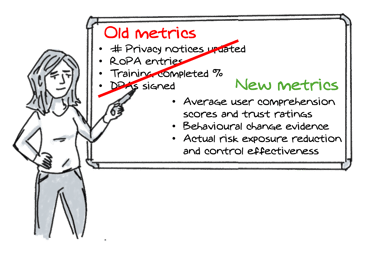
"We completed 7 DPIAs this quarter"
"Training compliance is currently at 64%"
"Our RoPA has 312 entries and was last viewed 9 months ago"
These are all activities. They tell you what happened, not whether it mattered. It's like a restaurant boasting about how many meals they served without mentioning whether customers enjoyed them or came back.
The problem with activity-based metrics is threefold:
They're backwards-looking because you're measuring things that already happened and can't be changed. If your RoPA wasn't touched for 9 months, that information helps no one make better decisions today.
Employees play a bit: When you measure training completion rates, people click through modules without engaging. When you measure the number of DPIAs, some teams split single assessments into multiple entries to hit targets.
They miss business impact: A 100% training completion rate means nothing if personal data is shared with a third party without a lawful basis, or the product team still maintain that tracking consumer sentiment does not involve processing personal data. High activity doesn't equal high effectiveness.

Lag versus lead indicators
Before looking at windshield reporting, it's important to understand the difference between lag and lead indicators. This distinction separates reactive compliance from proactive data protection leadership.
Lag indicators measure outcomes that have already occurred. They're historical, often called "results metrics," and tell you what happened after the fact. They're important for accountability and learning from experience, but they can't help you prevent problems or exploit opportunities in real-time.
Lead indicators are predictive measures that signal future performance. They track activities, behaviours, or conditions that influence future outcomes. Most importantly, they're actionable and you can intervene to change direction before problems occur.


On a personal level, if you've ever tried to lose weight, you'll know that simply weighing yourself (lag indicator) each day will rarely help you shed the kilos if you are not mindful of the number of steps or bike rides you accomplish daily (lead indicator) coupled with the amount of calories (lead indicator) of the food you consume each day.
Let me illustrate this with a couple of data protection examples.
Lag indicator #1: Marketing campaign launch delays due to data protection reviews.
This measures business impact after the friction has already occurred and is useful for understanding business costs of current processes or identifying high-friction areas, but it's too late because delays have already frustrated your colleagues in marketing and potentially cost revenue.
Instead, these lead indicators may be more appropriate:
Percentage of marketing campaigns with data protection consultation in planning phase
Average cycle time for routine data protection reviews
Number of self-service tools adopted by business units
Lag indicator #2: Data subject request (DSR) response rate.
This measures whether you met the required deadlines after requests were submitted and is useful for internal compliance reporting or identifying process bottlenecks. The issue is, it is "after the event" and misses the breakdown in trust with data subjects that may occur, which may trigger regulatory scrutiny if a complaint is made.
Instead, these lead indicators may provide you with the essential early warning signs so you can work to address things before go badly wrong:
Average data discovery time across key systems
Number of projects where DSR requirements were prioritised as non-functional requirements
Quality score of data mapping accuracy (validated through sample audits)
The rear-view mirror analogy
In my experience, data protection reporting often falls into what I call "rear-view mirror monitoring." You're required to constantly look at what's behind you. In other words, the things that have already happened such as completed tasks, incidents, DPIAs completed, etc. This has several disadvantages including:
By the time problems show up in your metrics, it's too late to prevent them. You're always playing catch-up.
High completion rates and low incident numbers give you a false sense of security. All appears fine until a major incident reveals the gaps.
Data protection risks don't conveniently announce themselves through your current metrics. They accumulate slowly through small violations, cultural drift, and emerging threats. This is where key risk indicators (KRIs) come into play, they are a form of lead indicator.
I first encountered this concept during my IBM days over 20 years ago when as a project manager I was required to use their "7 keys" methodology. The distinction between looking backward and looking forward transformed how I approached project monitoring and reporting, and, later, I adapted it to data protection performance management. I will make a separate post about this methodology because it deserves it!
Windshield reporting
Windshield (or windscreen as people living in the UK might say) reporting focuses on anticipating change and providing early warnings. Instead of only measuring what happened, you're identifying what's likely to happen and what you can do about it.
In data protection terms, this means:
Predictive indicators: Instead of only counting incidents after they occur, track leading indicators that predict future problems - unusual data access patterns, delayed vendor risk assessments, increasing numbers of "urgent" projects bypassing data protection gates or checkpoints in your portfolio management processes.
Stakeholder health monitoring: Rather than only measuring training completion, assess stakeholder engagement and behavioural change - are people proactively asking data protection questions, are they embedding data protection considerations into projects from the start?
Risk analysis: Instead of static risk heat maps, track how risks are trending - which processing activities are becoming more complex, which vendors are showing compliance drift, which business units are struggling with new technologies?
As I have done in all previous in this "beyond legal" series, suggest you consider looking at the SFIA skills framework to understand the competences you may need to acquire either yourself, or bring onboard. The key SFIA competence you need to make the necessary changes is the Performance Management (PEMT) skill, but you'll also require:
Data analytics (DAAN): Moving beyond basic reporting to statistical analysis that identifies patterns, trends, and predictive indicators.
Business Intelligence (BINT): Designing dashboards and reporting systems that show actionable insights rather then meaningless numbers.
Quality management (QUMG): Establishing quality metrics and continuous improvement processes that will drive real performance increases.
Make lead indicators actionable
Now something that is extremely important. The key to effective lead indicators is ensuring they drive action. Each lead indicator should have:
Clear thresholds: When does the indicator signal need for intervention? For example:
"When privileged access reviews are more than 30 days overdue for more than 20% of high-risk systems, initiate immediate remediation protocol"
Defined responses: What specific actions should be triggered? For example:
"When DPIA quality scores drop below 7/10 for any business unit, deploy additional training and assign dedicated support"
Responsible parties: Who monitors the indicator and who acts on it? For example:
"Security Operations monitors access patterns weekly and the Data Protection Team investigates anomalies within 48 hours"
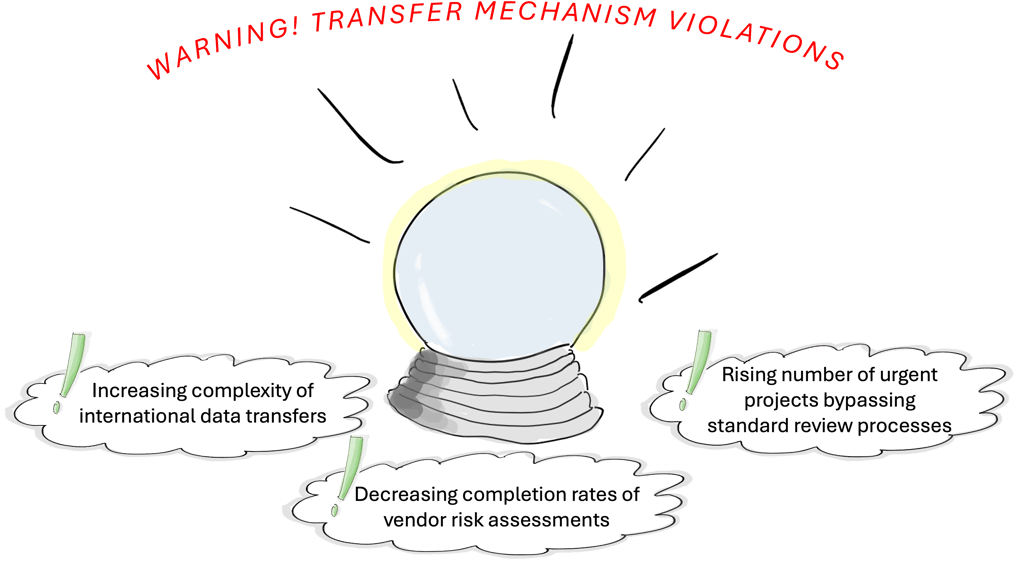
Establishing windshield monitoring and reporting takes time, and requires buy-in and interest from a wide range of stakeholders but the dividends are worth it. Once up and running you might want to consider taking things a step further by monitoring combinations of lead indicators that tell a more complete story. For example, you could build a model that predicts, say, the increased likelihood of transfer mechanism violations:
Lead: Increasing complexity of international data transfers (new jurisdictions, new data categories)
Lead: Decreasing completion rates of vendor risk assessments
Lead: Rising number of urgent projects bypassing standard review processes

Obviously, you need to walk before you can run.
Making metrics meaningful
Remember that quote from Jelly Roll that opened this post? It's not just about forward-looking versus backward-looking metrics. It's about people.
You will succeed or fail based on whether people find it useful, credible, and actionable, which means:
Design for your audience: Your CDO cares about different metrics than your CISO, who cares about different metrics than your CMO. Create tailored views that speak to each stakeholder's priorities and decision-making needs.
Make it visual and accessible: Dense spreadsheets and complex reports get ignored. Use dashboards, infographics, and storytelling to make performance data engaging and understandable.
Focus on trends and context: A single metric means nothing without context. Show trends over time, compare against benchmarks, and explain what the numbers mean for business decisions.
Enable action: Every metric should point towards a decision or action. If a stakeholder looks at your performance data and doesn't know what to do with it, the metric is useless.
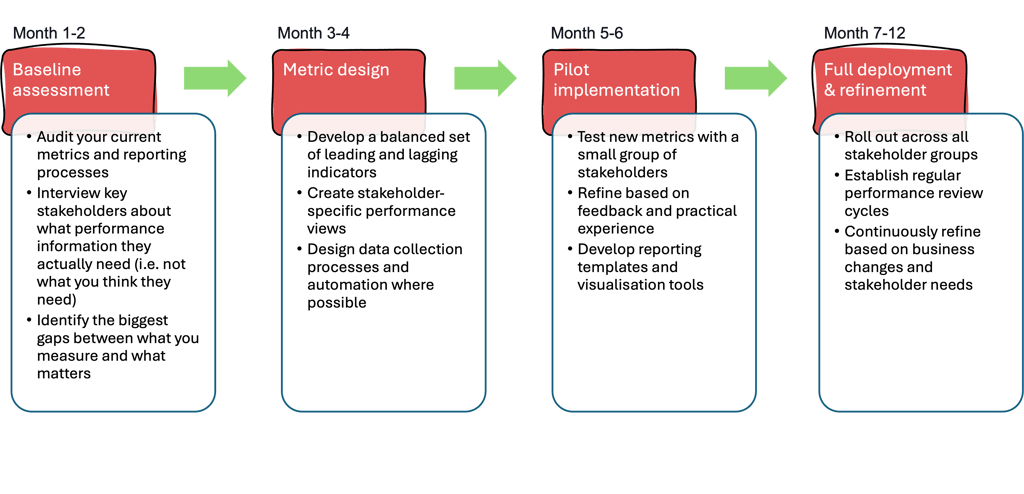
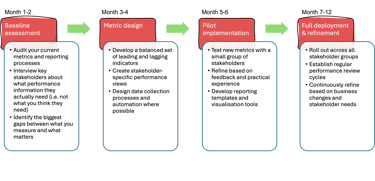
Here's a suggested implementation roadmap:
Finally, here are some things to watch out for:
Metric overload: Don't try to measure everything. Focus on the vital few metrics that drive the most important decisions. Start small and grow.
Perfection paralysis: Start with imperfect metrics that provide directional guidance. You can refine and improve over time.
One-size-fits-all reporting: Different stakeholders need different views of performance. Customise your reporting for maximum impact. Don't assume you know what your stakeholders need.
Static benchmarks: Your performance standards should evolve as your capabilities mature and your business context changes.
Purpose and Means is a niche data protection and GRC consultancy based in Copenhagen but operating globally. We work with global corporations providing services with flexibility and a slightly different approach to the larger consultancies. We have the agility to adjust and change as your plans change. Take a look at some of our client cases to get sense of what we do.
We are experienced in working with data protection leaders and their teams in addressing troubled projects, programmes and functions. Feel free to book a call if you wish to hear more about how we can help you improve your work.
Purpose and Means
Purpose and Means believes the business world is better when companies establish trust through impeccable governance.
BaseD in Copenhagen, OPerating Globally
tc@purposeandmeans.io
© 2026. All rights reserved.