Cutting through complexity: How visual communication helps data protection and GRC leaders convey their work to busy colleagues
Infographics, explainers, and one-pagers are indispensable visual communication tools for data protection and GRC leaders to effectively convey complex information to diverse stakeholder groups.
EMPLOYEE AWARENESSDATA PROTECTION DAYEDUCATION AND TRAININGDATA PROTECTION LEADERSHIPVIRTUAL COMMS. SUPPORTEXPLAINER
Tim Clements
3/27/20254 min read

As a data protection or GRC leader, you are tasked with navigating intricate frameworks, deciphering complex regulations, and building a culture of awareness across your company, but how do you effectively translate this often-dense (dare I say boring?) information into digestible insights for diverse audiences, ranging from your execs to every employee?
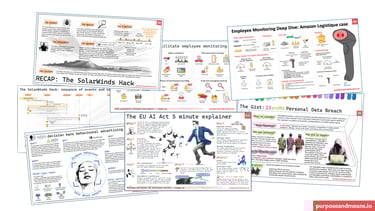
The answer, in my opinion, lies in the power of visual communication. Infographics, explainers, and one-pagers have emerged as invaluable tools offering a dynamic and engaging way to share complex topics and enable understanding for people who need to get the gist of something in the shortest space of time as possible.
Bridging the communication gap: Tailoring the message for every audience
One of the biggest challenges for data protection and GRC professionals is the diverse groups of stakeholders they need to engage with. Senior leadership requires high-level overviews, focusing on strategic implications and potential business impact. Broader employee awareness initiatives need clear, concise explanations that resonate with their daily roles and responsibilities. Legal teams need precise representations of processes and compliance requirements, while technical teams might benefit from more detailed visual breakdowns.
This is where the versatility of infographics, explainers, and one-pagers comes into play. These visual formats allow you to customise your message to the needs and understanding of your target audience. By strategically employing visuals, you can:
Simplify complexity for senior leadership: Instead of lengthy reports filled with technical jargon, present key risk indicators, compliance metrics, and the ROI of data protection initiatives in visually appealing and easily digestible formats. A well-designed infographic can quickly convey the essence of a complex situation, enabling faster and more informed decision-making at the highest levels.
Boost employee awareness and engagement: Supplement your dense policy documents (that often go unread) with explainers and visually rich one-pagers can transform abstract concepts like data protection principles or phishing awareness into relatable and memorable information. Engaging visuals can capture attention and break down complex procedures into actionable steps.
Enhance clarity for legal and technical teams: Detailed process flows, system architectures, and compliance frameworks can be effectively communicated through visual representations. Diagrams, timelines, and flowcharts can provide a clear and unambiguous understanding of complex legal requirements or technical implementations, reducing ambiguity and fostering better collaboration.
Context is everything: Defining your objectives and audience
Before even considering design elements, the foundation of an effective visual communication piece lies in clearly defining its context and objectives. Ask yourself:
Who is the target audience? What is their level of understanding of the topic? What are their key concerns and interests? What are their requirements? How can my communication help them succeed?
What is the primary message I want to convey? What are the key takeaways I want the audience to remember?
What action do I want the audience to take (if any)? Do I want them to adopt a new procedure, understand a risk, or approve a new initiative?
Understanding these key questions will guide every aspect of your visual creation, from the type of visual to the level of detail included. A one-pager aimed at raising employee awareness about password security will look vastly different from an infographic designed to brief the board on the company's ESG posture.
The power of diagrams: Visualising processes and relationships
Different types of diagrams can play a significant role in conveying specific types of information effectively. Consider the following:
Flowcharts: Ideal for illustrating processes, procedures, and decision pathways. They can clearly depict the steps involved in data breach response, access control workflows, or the lifecycle of personal data.
Hierarchy charts: Useful for showcasing organisational structures related to data protection responsibilities or the different levels of data sensitivity within the company.
Comparison charts: Excellent for highlighting the differences between various security tools, compliance frameworks, or risk levels.
Timelines: Effective for illustrating the sequence of events, such as the stages of a project implementation or the steps involved in an audit.
Personally, I'm a big fan of sequence diagrams and find them to be particularly powerful, especially when explaining interactions between different systems, individuals, or processes over time. They add a dynamic dimension to infographics, allowing you to visualise the flow of information or actions in a sequential manner. For instance, a sequence diagram could effectively illustrate the steps involved in a user authentication process, the flow of data during a transaction, or the interactions between different security controls during a potential threat. I often use them to break down the sequence of events in a high profile personal data breach and then share with my clients allowing them to ask themselves that important question: "Could this have been us?"
Infographics, explainers, and one-pagers: the same thing?
While the terms are often used interchangeably, there are subtle nuances that can help you choose the most appropriate format:
Infographics: Typically visually driven, presenting data, statistics, and information in a compelling and easily digestible format. They often incorporate a variety of imagery, and minimal text to convey key insights. Infographics are excellent for grabbing attention and providing a high-level overview of a topic.
Explainers: Focus on simplifying complex concepts or processes. They often use a combination of visuals and concise text to break down information into understandable chunks. Explainers might dig into more detail than a purely data-focused infographic and are excellent for educating an audience on a specific topic.
One-Pagers: As the name suggests, these are concise summaries of key information presented on a single page. They can incorporate elements of both infographics and explainers, providing a quick and easily digestible overview of a project, initiative, or key findings. One-pagers are often used for executive summaries or for providing a brief overview before a more detailed discussion.
Ultimately, the lines can blur, and the most important aspect is choosing a format that effectively communicates your message to your target audience.
The investment in visual clarity: It pays dividends, and is fun
Creating high-quality infographics, explainers, and one-pagers can sometimes require an investment of time and resources. Researching the information, structuring the narrative, designing the visuals, and ensuring accuracy all contribute to the production process. However, the return on this investment is significant.
Personally, I love the process of transforming complex information into compelling visuals - for me its great fun and I can often lose all track of time in thie creative process! There is a certain satisfaction in taking a dense topic and crafting a visual narrative that makes it clear, engaging, and impactful. It’s a creative outlet that I embrace.
Does this resonate? Take a look at our infographics resource to see examples of our work, and then feel free to get in touch to arrange a no obligation call to discuss your visual needs.
Purpose and Means
Purpose and Means believes the business world is better when companies establish trust through impeccable governance.
BaseD in Copenhagen, OPerating Globally
tc@purposeandmeans.io
© 2026. All rights reserved.