The messy reality of data protection risk
This post introduces a work-in-progress Causal Loop Diagram, evolving from my earlier "ripple effects" model, that uses the QSEM tool to visualise the messy, interconnected reality of systemic data protection risks and feedback loops.
RISK ALIGNMENTDATA PROTECTION MATURITYDATA PROTECTION LEADERSHIPGOVERNANCE
Tim Clements
12/12/20257 min read
If you have worked in data protection for more than a week, you know that risk is rarely a straight line. You don’t just have a compliance gap that leads neatly to a fine. You have a messy, interconnected ecosystem where a decision made in product development today can trigger an investigation by a Supervisory Authority three years later, which cuts the budget for the very tools needed to fix the original problem.
I have been trying to move away from flat, linear risk registers and visualise this reality.
Some of you may remember an earlier "ripple effects" diagram and post I published earlier this year. The diagram was actually made 2-3 years ago with close input from Jason Cronk. But as I dug deeper, I realised that a simple ripple didn't capture a critical element of our work: feedback loops.
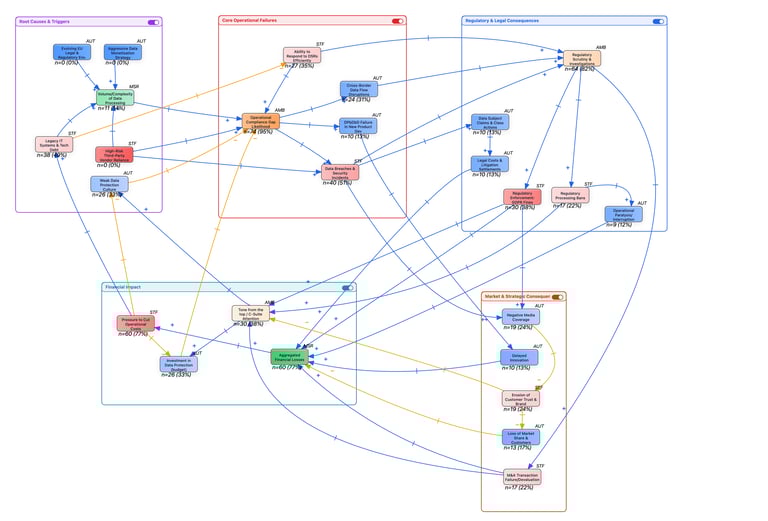
What you see below is the evolution of that work. It is a work in progress Causal Loop Diagram (CLD) representing the systemic risks of processing personal data under frameworks like the GDPR. Click to enlarge the diagram.

Before diving into the map, credit where it is due. This diagram was created using the excellent QSEM (Qualitative System Dynamics structuring and analysis modeling) tool which has been developed by Adam Hulme
If you are trying to structure complex qualitative problems, I highly recommend exploring it. It allows you to move beyond static flowcharts and model dynamic relationships between variables.
What am I looking at?
This is a Causal Loop Diagram. Unlike a standard process diagram that shows how something happens sequentially, a CLD shows why things behave the way they do over time.
One important thing to note, is the diagram does not currently reflect the extremely important type of risk that data protection is very much about: risks to the rights and freedoms of individuals - that will come in a future iteration.
It represents the data protection risk ecosystem of a typical global company operating in the EU. It maps the inputs (root causes), the operational engine of failure, the triggering of different risk types, and, importantly, how the financial consequences feed back into the system to either fix the problem or make it worse.
How to interpret the diagram
Don't let the initial complexity overwhelm you. Here is how to break down the elements:
1. The coloured sub-systems
To make the map readable, I have grouped related factors into coloured sub-systems:
Purple (top-left): Root causes & triggers. The foundational pressures such as strategy, tech debt, and culture, that create risk.
Red (centre): Core operational failures. Where daily processes break down, leading to gaps and personal data breaches.
Dark blue (top-right): Regulatory & legal consequences. The hard risks involving regulators and courts.
Orange (bottom-right): Market & strategic consequences. The soft (but equally damaging) risks involving reputation and customers.
Light blue (bottom-left): Financial impact. Where all roads eventually lead, the bottom line and the subsequent budget decisions.
2. The connections (+ / -)
The arrows show causality, and the symbols on them indicate the direction of change:
A blue plus sign (+) means "changes in the same direction." If A increases, B increases. (e.g., More personal data breaches lead to more negative media).
An orange minus sign (-) means "changes in the opposite direction." If A increases, B decreases. (e.g., More investment in security leads to fewer operational gaps).
3. The metrics (n and %)
You will see numbers on the bottom of each node, for example: n=27 (35%).
It's important to note that this diagram is a qualitative tool for understanding structure, not a quantitative tool for calculating financial exposure.
'n' (in-degree): within this specific map structure, this indicates connectivity, i.e. how many other variables are directly influencing this node.
'%' (relative weight): This is a structural metric calculated by the QSEM tool based on the map's current configuration, indicating the relative centrality or potential structural impact of that node within this specific model.
Do not read these as real-world probabilities or financial data. They are indicators of systemic connectivity within this map. To work with real-world probabilities and estimate financial losses, I recommend looking at the FAIR model.
What story does the diagram reveal at the moment (remember, it's still work in progress)?
By tracing the flows, a clear narrative emerges about how data protection risks materialise.
The drivers:
It starts in the top-left (purple). Pressures like Aggressive Data Monetisation and Legacy IT/Tech Debt put immense pressure on the system. When combined with a Weak Data Protection Culture, these pressures pour into the centre (red), increasing the Operational Compliance Gap Likelihood.
The triggering of risk:
Once that operational gap widens, failures become inevitable, personal data breaches, ignored DSRs, or failed data transfers. These failures ripple outward to the right:
They trigger Regulatory Scrutiny (dark blue), leading to fines or crippling processing bans.
Simultaneously, they fuel Negative Media (orange), eroding customer trust and market share.
The feedback loops:
All these consequences converge in the bottom-left (light blue) as Aggregated Financial Losses. This is where the system reaches a decision point, modeled by two key feedback loops:
The vicious cycle: Financial losses create Pressure to Cut Operational Costs. If this pressure leads to divesting from data protection tools, resources and deprioritising culture, the orange arrows show the path looping back to the start, increasing tech debt and weakening culture. The problem just made itself worse.
The corrective loop: Alternatively, if the financial pain, regulatory fear, or reputation loss is severe enough, it triggers Executive Board Attention. This attention forces Investment in Data Protection, creating a balancing loop (the blue arrow going straight up) that reduces the operational gaps.
Embracing the mess
When you look at this diagram, your first thought might be, "That looks a complete mess."
It is messy because the reality we manage is messy.
If I showed you a neat, linear list of ten risks on a spreadsheet, I would be lying to you about how the world works. Real organisational risk is spaghetti.
This diagram is not something you throw up on a slide for a 5-minute board update (unless they specifically request a deep-dive into systemic root causes).
But as a Data Protection Leader, I hope you find this useful. It should help you identify where the real levers are. It helps explain why hiring two more data protection analysts won't fix a problem that is rooted in a ten-year-old legacy IT strategy and a sales-first culture.
This is an ongoing project. The QSEM has so much more analysis functionality so this diagram will evolve. I will share further progress in the future.
Interested to know more about this approach to mapping risk, or you would like to discuss your requirements and hear how Purpose and Means can help? Book a call here.
Context
For further context, I have provided descriptions of the factors that are shown on the diagram:
Root causes & triggers
Aggressive data monetisation strategy
A business strategy focused on maximising revenue from personal data (e.g., behavioural advertising, selling insights) that often outpaces data protection controls and ethical considerations.
Legacy IT systems & tech debt
Outdated infrastructure and fragmented databases that were not built for GDPR. They make it technically difficult to erase data, secure it properly, or find it for access requests.
Evolving EU legal & regulatory env
The constantly shifting baseline of compliance. Includes new CJEU rulings (like Schrems), new guidelines from the EDPB, and relevant laws like the EU AI Act or Data Act.
High-risk third-party vendor reliance
Heavy dependence on data processors (e.g., cloud providers, payroll services) in jurisdictions or sectors with lower security standards. Under GDPR, you own their risks.
Weak data protection culture
A lack of genuine commitment from leadership ("tone from the top"). Employees prioritize speed/profit over compliance because they don't believe privacy matters to the company.
Volume/complexity of data processing
The sheer scale, geographic spread, and sensitivity of data being handled. The more complex the processing (e.g., AI profiling), the harder it is to control.
Pressure to cut operational costs
The immediate corporate reaction to financial losses or market downturns, leading to budget freezes across non-revenue generating departments like compliance.
Tone from the top / C-suite attention
When data protection risks become so severe they hit the Board agenda. This is usually a reactive state driven by fear of personal liability or massive company damage.
Investment in data protection (budget)
Budget allocated specifically to data protection headcount (DPOs, legal counsel), training programmes, and technical security tools (encryption, access controls).
Core failures
Operational compliance gap likelihood
The increasing probability that daily operations are failing basic GDPR requirements (e.g., data minimisation, retention periods, lawful basis documentation).
Personal data breaches & security incidents
A failure of technical or organisational measures (Art. 32) leading to accidental or unlawful destruction, loss, alteration, or unauthorised disclosure of data.
Inefficient response to DSRs
Failure to fulfill Data Subject Rights (access, erasure, rectification) within the one-month deadline due to bad processes or inability to find the data.
Cross-border data flow disruptions
Legal inability to transfer personal data to third countries because transfer mechanisms (like SCCs) are deemed invalid or challenged by hacktivists (e.g. Schrems) or regulators.
DPbDbD failure in new product dev
Inability to implement "Data Protection by Design and Default" (Art. 25) during the innovation phase, meaning new products are launched non-compliant.
Risks & ripple effects
Regulatory scrutiny & investigations
Regulatory risk: Being targeted by Supervisory Authorities for audits, formal inquiries, or demanding information based on complaints or breach reports.
Regulatory enforcement: GDPR Fines
Regulatory/financial risk: The issuing of administrative fines by Supervisory Authorities.
Regulatory processing bans
Regulatory/operational risk: Orders from Supervisory Authorities under Art. 58(2) imposing a temporary or definitive ban on processing. This is often more damaging than a fine.
Operational paralysis/interruption
Business continuity risk: The immediate halt of core business functions because a processing ban stops you from using essential data or systems.
Data subject claims & class actions
Legal risk: Lawsuits filed by individuals or collective redress bodies (like consumer unions) seeking compensation under GDPR Art. 82.
Legal costs & litigation settlements
Legal/financial risk: The direct costs of defending lawsuits (external counsel fees, court costs) and the payouts required to settle claims.
Negative media & scrutiny
Reputational risk: Public exposure of data protection failures by journalists or advocacy groups (like NOYB), damaging the company's public image.
Erosion of customer trust & brand
Reputational risk: The measurable decline in consumer confidence and brand valuation resulting from perceived negligence with personal data.
Loss of market share & customers
Market risk: Existing customers leaving for competitors they trust more, and an inability to acquire new customers due to a toxic reputation.
Delayed innovation & competitive loss
Strategic risk: Being slower to market than competitors because products have to be redesigned to fix data protection flaws that weren't caught early.
M&A transaction failure/devaluation
Strategic/financial risk: A merger or acquisition collapsing, or the purchase price being drastically reduced, because due diligence reveals massive hidden data protection liabilities.
Aggregated financial losses
Financial risk: The total bottom-line impact combining fines, legal costs, lost revenue, operational downtime, and reduced company valuation.
Purpose and Means
Purpose and Means believes the business world is better when companies establish trust through impeccable governance.
BaseD in Copenhagen, OPerating Globally
tc@purposeandmeans.io
© 2026. All rights reserved.